Crypto trading is an intricate game of timing, strategy, and market analysis. Traders rely on technical indicators to make informed decisions, and one of the most widely used tools is the Moving Average Convergence Divergence (MACD) indicator. This momentum-based trend-following tool helps traders identify potential buying and selling opportunities in the volatile cryptocurrency markets.
In this article, we will explore what the MACD indicator is, how it functions, and how crypto traders can effectively use it to improve their trading strategies.
What is the MACD Indicator?
The MACD (Moving Average Convergence Divergence) is a technical analysis tool developed by Gerald Appel in the late 1970s. It is designed to measure momentum and identify trend reversals by analyzing the relationship between two moving averages of an asset’s price.
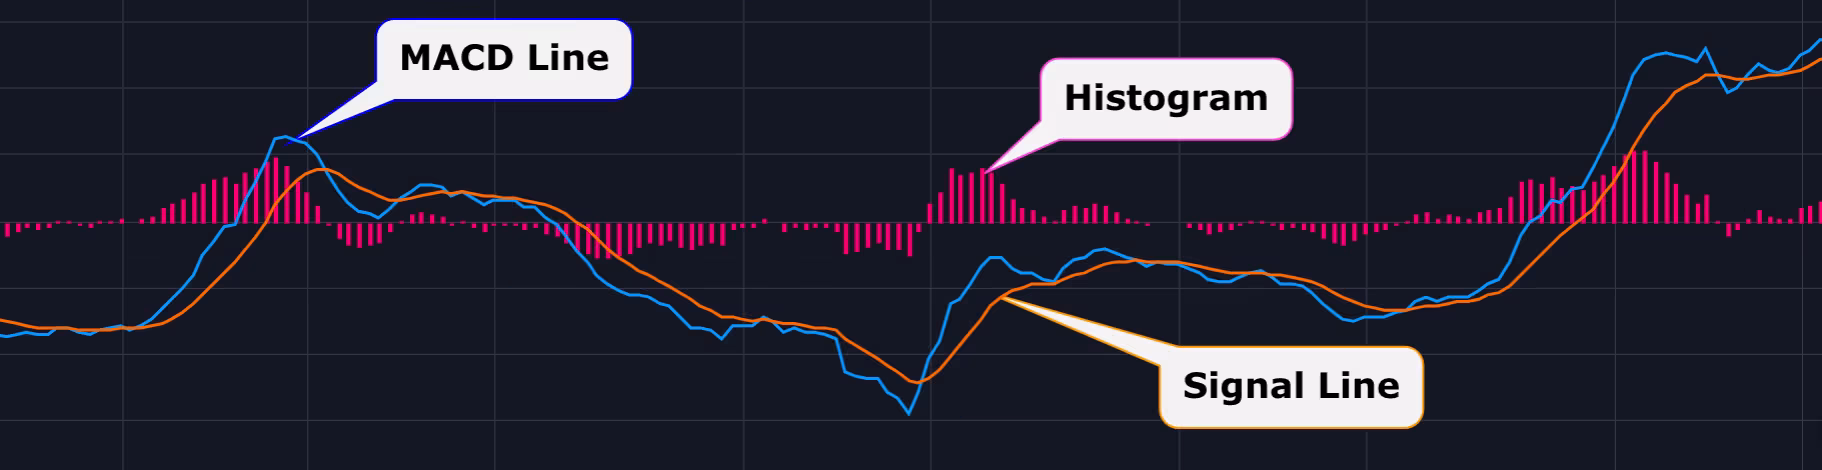
The MACD consists of three key components:
MACD Line: This is the difference between the 12-day Exponential Moving Average (EMA) and the 26-day EMA.
Signal Line: This is a 9-day EMA of the MACD line. It helps smooth out fluctuations and provides potential buy/sell signals.
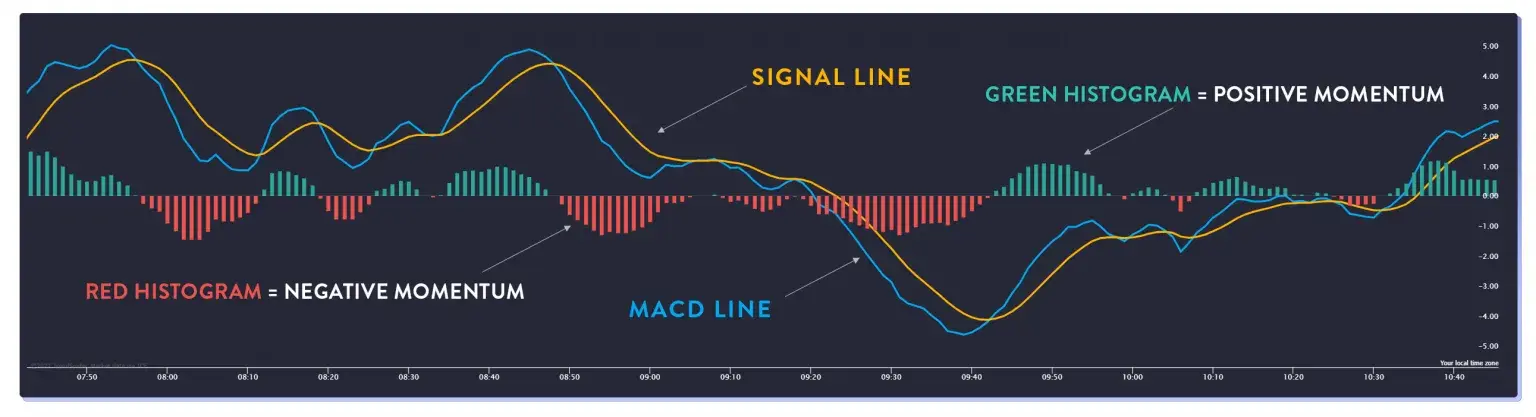
Histogram: This represents the difference between the MACD line and the Signal line. The histogram visually indicates momentum changes.
The MACD indicator fluctuates above and below a zero line (also called the centerline), which helps traders determine bullish and bearish trends.
How to Use the MACD Indicator in Crypto Trading
1. Identifying Trend Strength and Direction
The MACD is particularly useful for understanding trend strength and direction. When the MACD line crosses above the Signal line, it suggests that bullish momentum is increasing, signaling a potential buy opportunity. Conversely, when the MACD line crosses below the Signal line, it indicates bearish momentum, signaling a potential sell opportunity.
Crossovers are one of the most common MACD trading signals:
3. MACD Histogram Analysis
The MACD histogram provides additional confirmation of momentum shifts. If the histogram is above the zero line and growing in size, it indicates increasing bullish momentum. On the other hand, if it is below the zero line and expanding downward, it signifies growing bearish momentum.
A shrinking histogram (whether positive or negative) suggests that the current trend is losing strength, which may signal an upcoming reversal.
4. Identifying Overbought and Oversold Conditions
While the MACD is not traditionally used as an overbought/oversold indicator like the RSI (Relative Strength Index), extreme MACD levels can indicate that an asset is overextended. If the MACD moves far above or below the zero line, it suggests that the asset may be due for a price correction.
5. Divergence Signals for Reversals
Divergence between price action and the MACD indicator is a powerful signal for potential reversals.
Strategies for Crypto Trading Using MACD
1. MACD Trend-Following Strategy
A simple strategy is to enter a trade when the MACD confirms the trend:
2. MACD and RSI Combo Strategy
Combining MACD with the Relative Strength Index (RSI) can improve trading accuracy:
3. MACD Scalping Strategy
For short-term traders, using MACD on smaller timeframes (e.g., 5-minute or 15-minute charts) can help identify quick entry and exit points. Scalpers look for rapid MACD crossovers to capture small price movements within a trend.
Limitations of the MACD Indicator
While the MACD is a valuable tool, it is not foolproof. Some limitations include:
Lagging Indicator: Since MACD is based on moving averages, it may provide signals after a trend has already started.
False Signals: In highly volatile crypto markets, MACD crossovers can sometimes produce false signals, leading to losses if not confirmed by other indicators.
Not Ideal for Sideways Markets: MACD performs best in trending markets but may provide misleading signals in ranging or sideways conditions.
The MACD crypto trading indicator is a powerful tool for identifying trends, momentum shifts, and potential entry/exit points. By understanding its signals—crossovers, histograms, and divergences—traders can make more informed decisions. However, it is essential to combine MACD with other indicators and risk management strategies to minimize potential losses and maximize gains.
Mastering the MACD in crypto trading requires practice, but with time, it can become a valuable asset in any trader’s technical analysis toolkit. Whether you are a beginner or an experienced trader, leveraging MACD effectively can help you navigate the fast-paced world of cryptocurrency trading with greater confidence.